In the full-time study programme Business Informatics and Digital Transformation of 2019, we created a Dashboard for interpreting and representing raw telemetry data. The goal of the thesis was to give comprehensive advice on why data should be consolidated, as well giving a short example of how to represent the given data.
With further digitization and data gathering, the industry has changed in its structure fundamentally. Companies have to change their planning, optimization, and have to adapt to a dynamic, changing and fast paced environment. Thus, the main challenges were identifying important data sources, gathering them, transforming the data into a uniform and easily usable format, and finally analysing it.
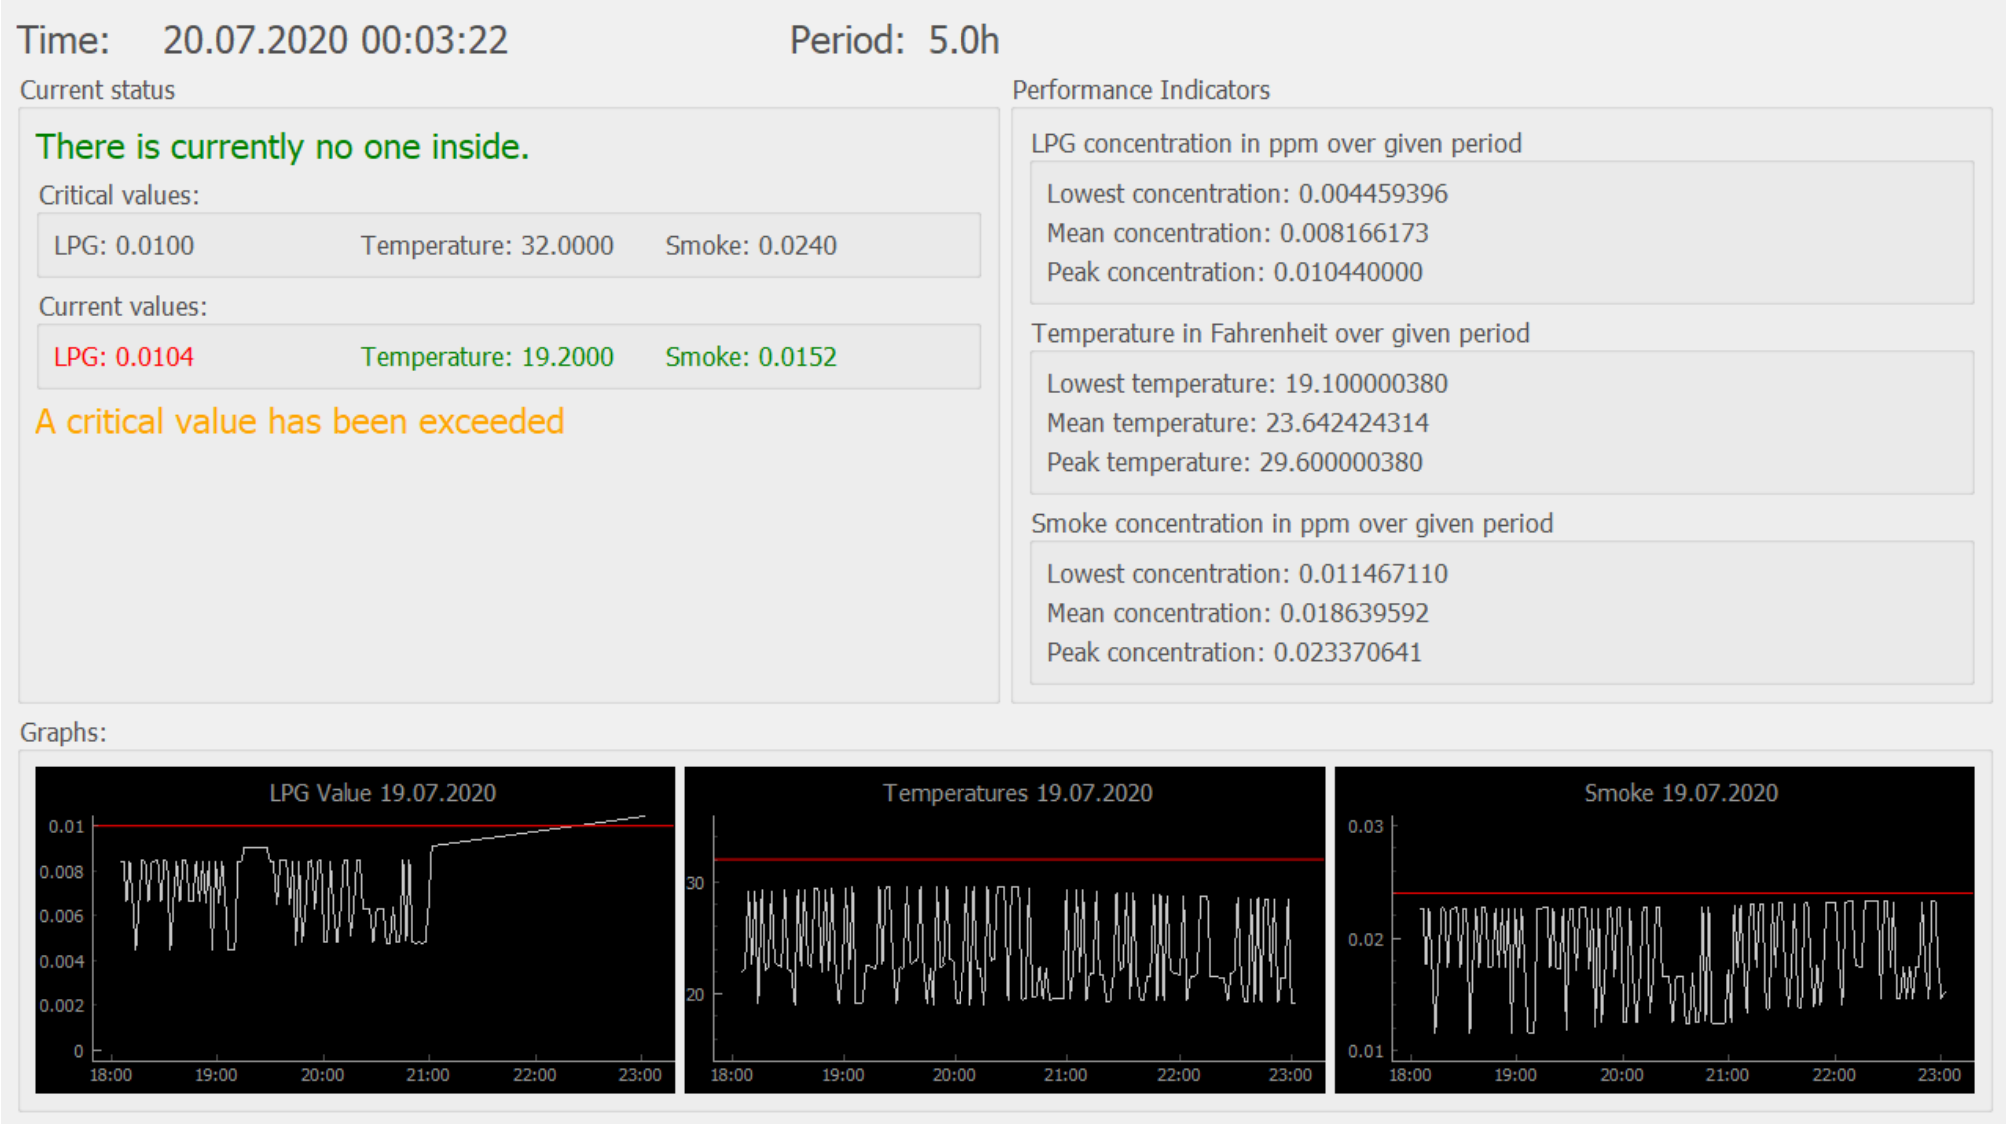
For our project we used Sensor-Telemetry data. The dataset had over 405.184 entries, each with multiple values for temperature, smoke-, liquid petroleum gas- and carbon monoxide concentrations, as well as for light and motion. We also generated a dataset that simulated an access control system, in order to represent a use-case of an early warning and monitoring system in a production hall.
We used ‘pandas’, a data analysis library for python, as well as PyQt5, in order to build a dashboard prototype. We chose important KPIs to represent in the dashboard, as well as the corresponding critical values. Since it works with a given dataset and not live data, the application needs a time input from the user, in order to give a meaningful output.
Facts:
Typ: Bachelorprojekt
Studiengang: Bachelor Wirtschaftsinformatik & Digitale Transformation